Power Plant Optimization
Data-Driven Efficiency & Environmental Impact Assessment
Project Summary
Overview
Coal-fired power plants are central to electricity generation but grapple with fuel inefficiency, high emissions, and the limitations of manual control. This project harnesses SCADA data to optimize operations using machine learning, while simultaneously analyzing the Environmental Impact (EIA) of such facilities.
The Problem
Manual, heuristic-based operations result in significant inefficiencies, high coal consumption, and challenges in meeting emission regulations (SO2, NOx, PM).
Objectives
- Build a data-driven framework to model plant operations.
- Perform a comprehensive Environmental Impact Assessment (EIA).
- Optimize operational parameters to improve fuel efficiency.
- Provide actionable recommendations to reduce pollution load.
How a Coal-Fired Power Plant Works
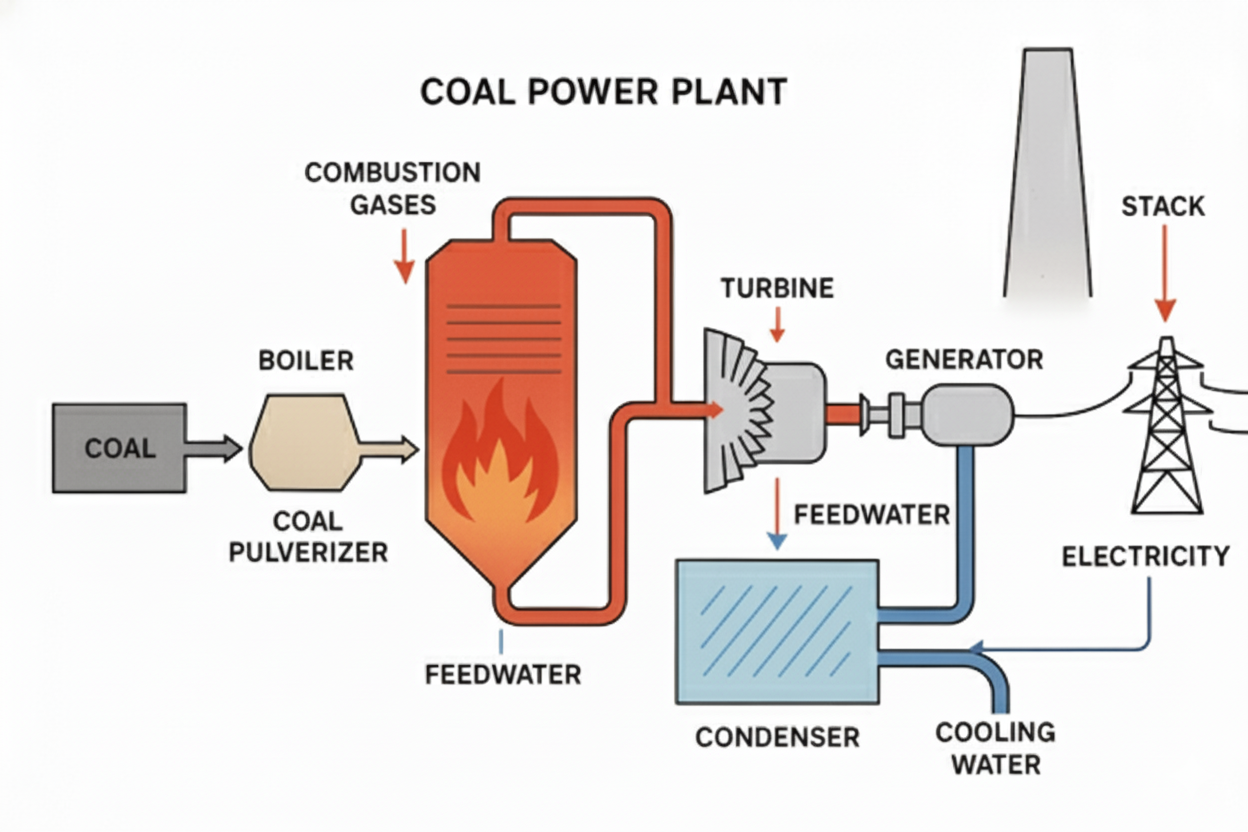
Fig 1: Schematic of a typical coal-fired power plant.
A thermal power station uses a Rankine Cycle. Water is heated to steam, which spins a turbine to drive a generator.
Key Process Steps:
- Combustion: Pulverized coal burns in the furnace.
- Steam Generation: Heat converts water in the boiler drum to high-pressure steam.
- Turbine Rotation: Steam spins the HP, IP, and LP turbines.
- Power Generation: The turbine drives the Turbo Generator.
- Emissions Control: Electrostatic Precipitators (ESP) extract fly ash.
- Cooling: Steam is condensed and recycled; heat is released via Cooling Towers.
Environmental Impact Assessment (EIA)
A critical analysis of the pollution load and environmental challenges associated with thermal power generation. This assessment identifies key areas where optimization can reduce ecological footprints.
Plant Machinery & Functions
Coal Handling
- Wagon Tippler: Tips coal from wagons to conveyor belts (12 wagons/hr).
- Crusher: Breaks coal into smaller chunks.
- Coal Mills: Grinds coal into pulverized powder for efficient burning.
Core Operations
- Furnace & Boiler: Where combustion occurs and water turns to steam.
- Turbine & Generator: Converts mechanical energy into electricity.
- Condenser: Converts steam back to water, removing non-condensable gases.
Environmental Control
- ESP (Electrostatic Precipitator): [Image of Electrostatic Precipitator] Uses electrodes to attract and extract fly ash from flue gases.
- Cooling Tower: [Image of Cooling Tower working principle] Cools water by evaporation (~143.5m height).
- Chimney: Releases treated flue gases at high altitude.
High Particulate Matter (PM) from inferior coal. Emissions of SO2, NOx, and CO2 (Greenhouse gas).
Effluents from ash ponds, condenser cooling towers, DM plant, and boiler blowdown.
High decibel levels from high-pressure steam release, fans, turbines, and motors.
~100 million tonnes of fly ash generated annually. Disposal occupies vast agricultural/forest land.
Daily Pollution Load (Estimates)
Based on CPCB 2012 Data for Coal Based Plants
| Pollutant | Emissions (Tonnes/Day) |
|---|---|
| CO2 | 424,650 |
| NOx | 4,966 |
| Particulate Matter (PM) | 4,374 |
| SO2 | 3,311 |
Compliance Status (India)
*Based on sample data from CPCB Report 2012
Why Do Plants Fail Environmental Standards?
Data and Methodology
About the Data
The dataset consists of over 110 parameters from the plant's operational logs. The primary goal was to predict the `GENERATOR MW` (the power output) based on a wide range of input variables.
- Output Variable: GENERATOR MW
- Fuel & Combustion: TOTAL COAL FLOW, Damper Positions
- Airflow: TOTAL AIR FLOW, Furnace Draft Pressure
- Steam Cycle: Main Steam Line Temp, Water Flow
Methodology
- Data Collection: Gathered historical SCADA data.
- Preprocessing: Cleaned data, handled outliers, and scaled features.
- Feature Engineering: Created new, insightful features like air-to-fuel ratios and temperature differentials.
- Model Training: Trained and tuned Machine Learning models to predict power output.
- Optimization: Used the trained model with an optimization algorithm (Optuna) to find the best operating parameters.
Modeling and Performance
Feature Importance
The XGBoost model allowed us to identify the most influential factors. `TOTAL COAL FLOW` and `TOTAL AIR FLOW` were, as expected, highly significant.
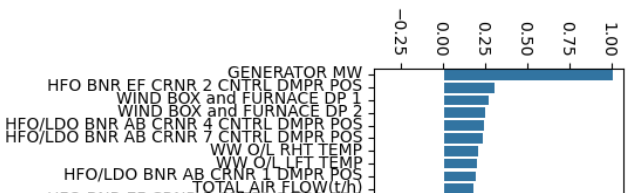
Fig 2: Top 10 most important features.
Models Used
Two primary models were evaluated for this regression task. The XGBoost model provided superior performance after extensive hyperparameter tuning.
1. Random Forest Regressor
A strong baseline model.
2. XGBoost Regressor (Final Model)
Demonstrated higher accuracy and better captured the system's non-linearities.
Performance Metrics
The tuned XGBoost model achieved a high R-squared value, indicating it explains nearly 88% of the variance in power output.
| Model | R-squared |
|---|---|
| Random Forest | 0.8212 |
| Tuned XGBoost | 0.8797 |
Optimization Results
The core of the project was to use our accurate model to find a "sweet spot" of operational settings. The optimization algorithm successfully identified a set of parameters predicted to significantly boost efficiency.
| Parameter | Typical Operation (Baseline) | Optimized Operation (Predicted) | Improvement |
|---|---|---|---|
| Generator MW | ~635 MW | 695.47 MW | +9.5% |
| Total Coal Flow | ~346.5 t/h | 325.60 t/h | -6.0% |
Deployment & Conclusion
The final model was packaged into a production-ready API using FastAPI. This allows the optimization logic to be seamlessly integrated into the plant's internal dashboards and real-time analytics pipelines, providing operators with data-driven recommendations.
This project successfully demonstrates that significant efficiency gains are possible not by pushing individual inputs to their limits, but by finding a more harmonious and efficient balance between them, discovered through machine learning.