E-Commerce Insights Report
Analyzing the Quick-Commerce Landscape with Power BI
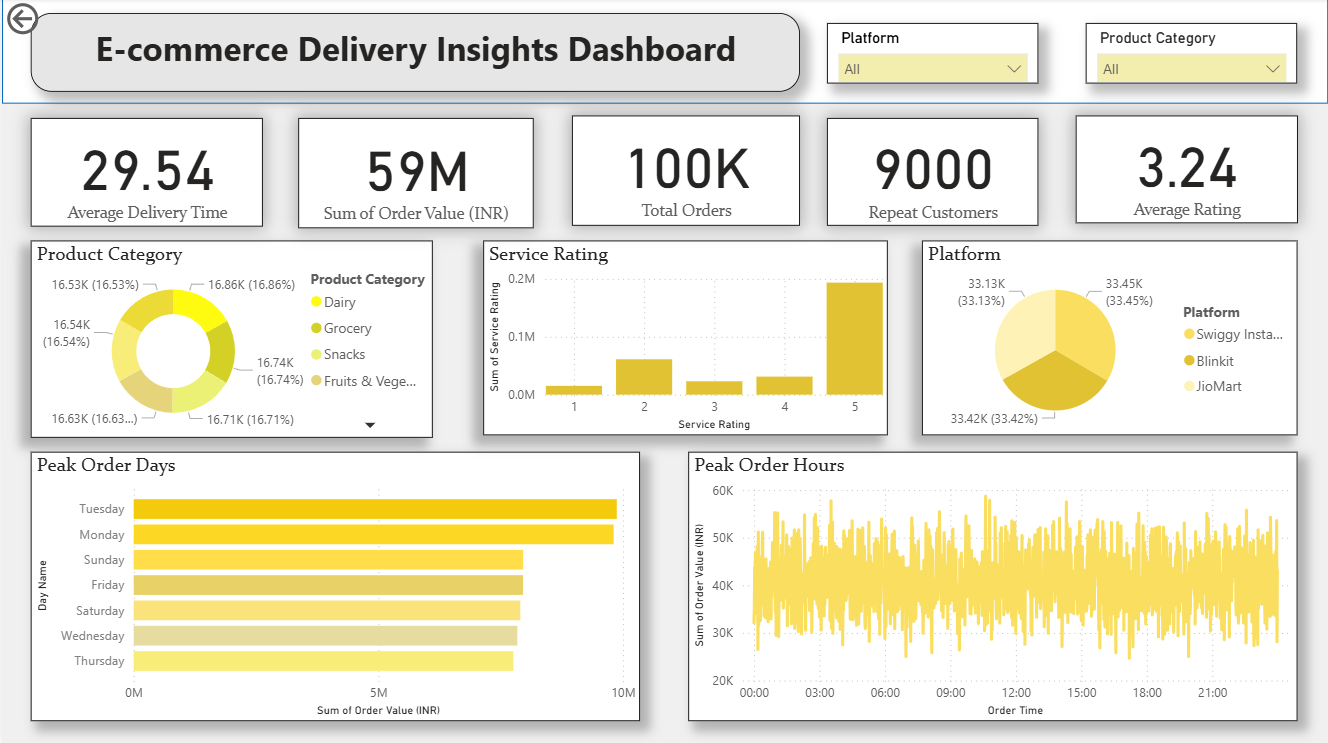
Overall Performance At a Glance
₹59M
Total Order Value
100k
Total Orders
9K
Repeat Customers
29.5m
Avg. Delivery Time
3.24 ★
Avg. Service Rating
Power BI Dashboard
An interactive dashboard was created in Power BI to visualize the key findings from the 100,000-row dataset. It provides a comprehensive overview of sales, customer behavior, and delivery performance.
Detailed Analysis & Key Findings
Market & Product Landscape
Platform Distribution
Swiggy Instamart, Blinkit, and Jiomart each contribute approximately 33% to total order volumes, indicating a highly competitive market with no single dominant player.
Product Category Performance
Top categories (Dairy, Grocery, Snacks, Fruits & Veg) show a balanced demand, each accounting for around 16.5%–16.8% of total orders. This suggests customers use these platforms for a wide variety of daily needs.
Customer Behavior & Trends
Customer Ratings & Service
A majority of customers provide a 5-star rating, with fewer ratings in the 1-4 range. This suggests a polarized experience: customers are either very satisfied or left dissatisfied, with little middle ground.
Peak Order Trends
Peak Days: Tuesday, Monday, and Sunday see the highest order volumes.
Peak Hours: Demand spikes in the early morning (2-6 AM) and again in the late evening.
Tech Stack
Conclusion & Impact
This report provides a granular breakdown of trends, customer behavior, and platform performance in the competitive Indian quick-commerce space. The insights generated are actionable and can be used to directly improve marketing strategies, optimize delivery operations, and enhance overall customer satisfaction across all platforms.